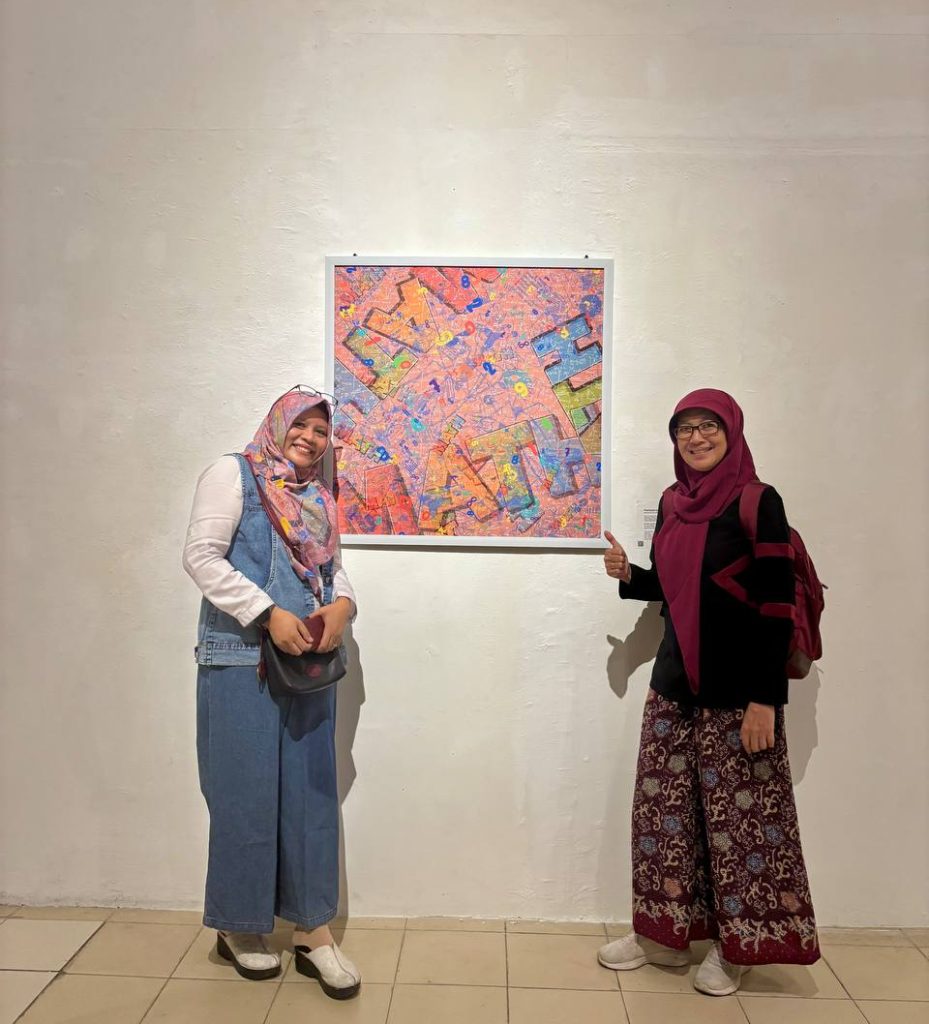
The First Data and Science Art Exhibition in Indonesia
Marking Indonesia’s 80th Independence Day, this exhibition highlights how science and data can be reimagined through the language of art.
Location: Jogja Gallery, Yogyakarta
Date: August 25 – 30, 2025
Time: 12:00 PM – 8:00 PM
Featured Works from the Algebra Laboratory, Department of Mathematics, Universitas Gadjah Mada,
Supervised by Prof. Indah Emili Wijayani and Prof. Yeni Susati.
Abdul Hadi:
“Data.RT events provide opportunities for mathematicians to explore new ways of conveying complex ideas to the public, including through color, form, and interactivity. It gives the impression that math is not just about counting and complexity. It is also a stunning display of artistic beauty.”
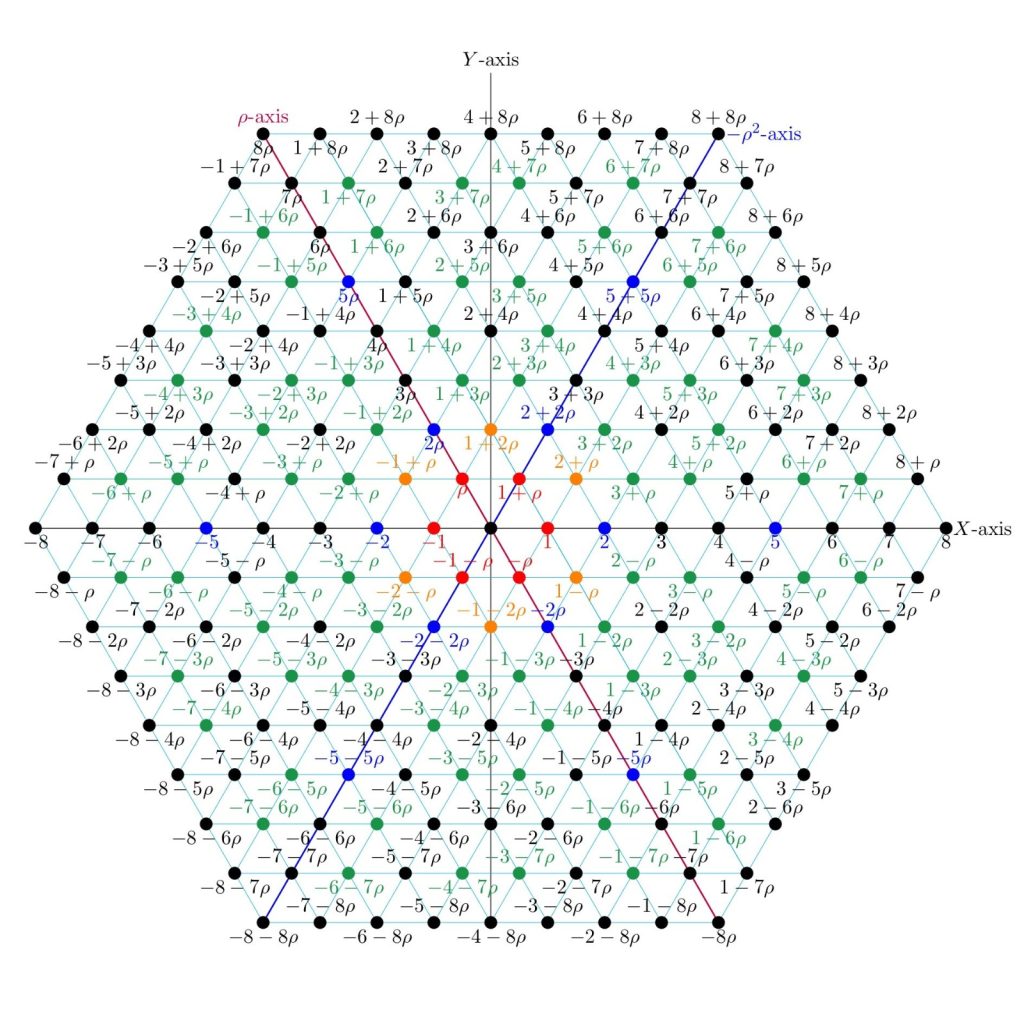
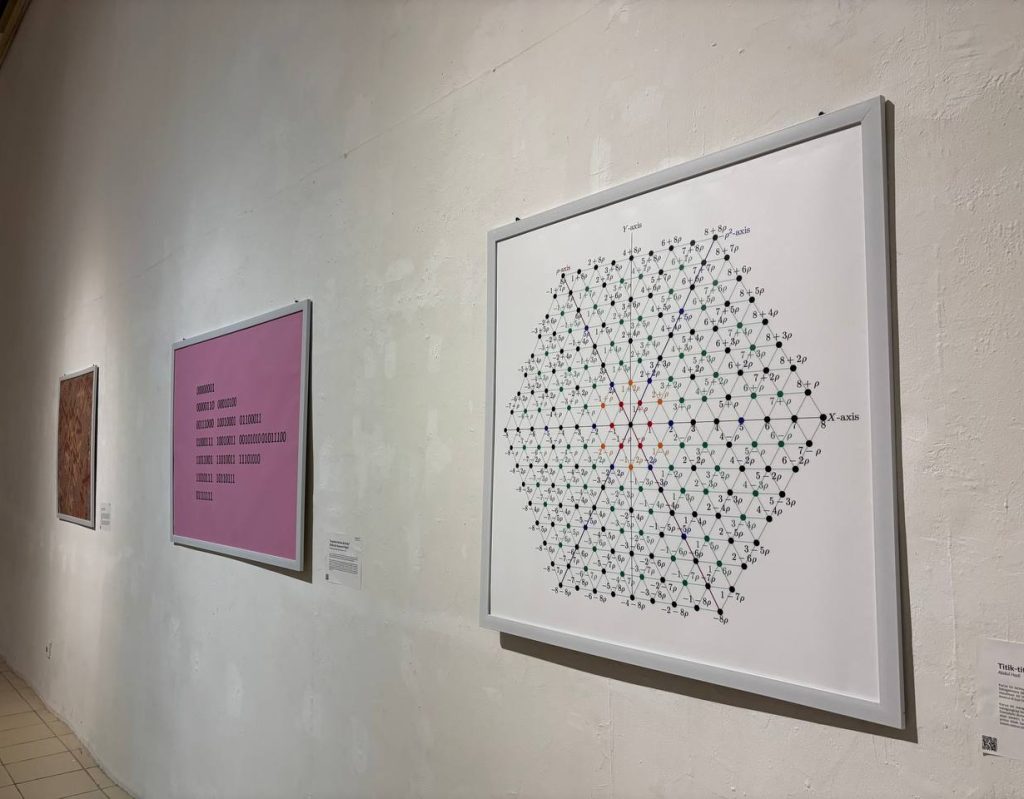
My work is a visualization of prime numbers within a set of complex numbers. Just as prime numbers play an important role in data security systems, this visualization invites viewers to learn about other prime number concepts that appear outside of integers, particularly in the realm of complex numbers.
This work explores Eisenstein prime number patterns within a specific distance limit, revealing mathematical beauty that is rarely highlighted. There are 3 categories of Eisenstein prime numbers visualized with different colors, forming a geometric landscape rich in symmetry. Thru this approach, the audience is invited to realize that the concept of prime numbers is not limited to integers, but also has a deep structure within the complex number system that opens up new opportunities for analysis and application.
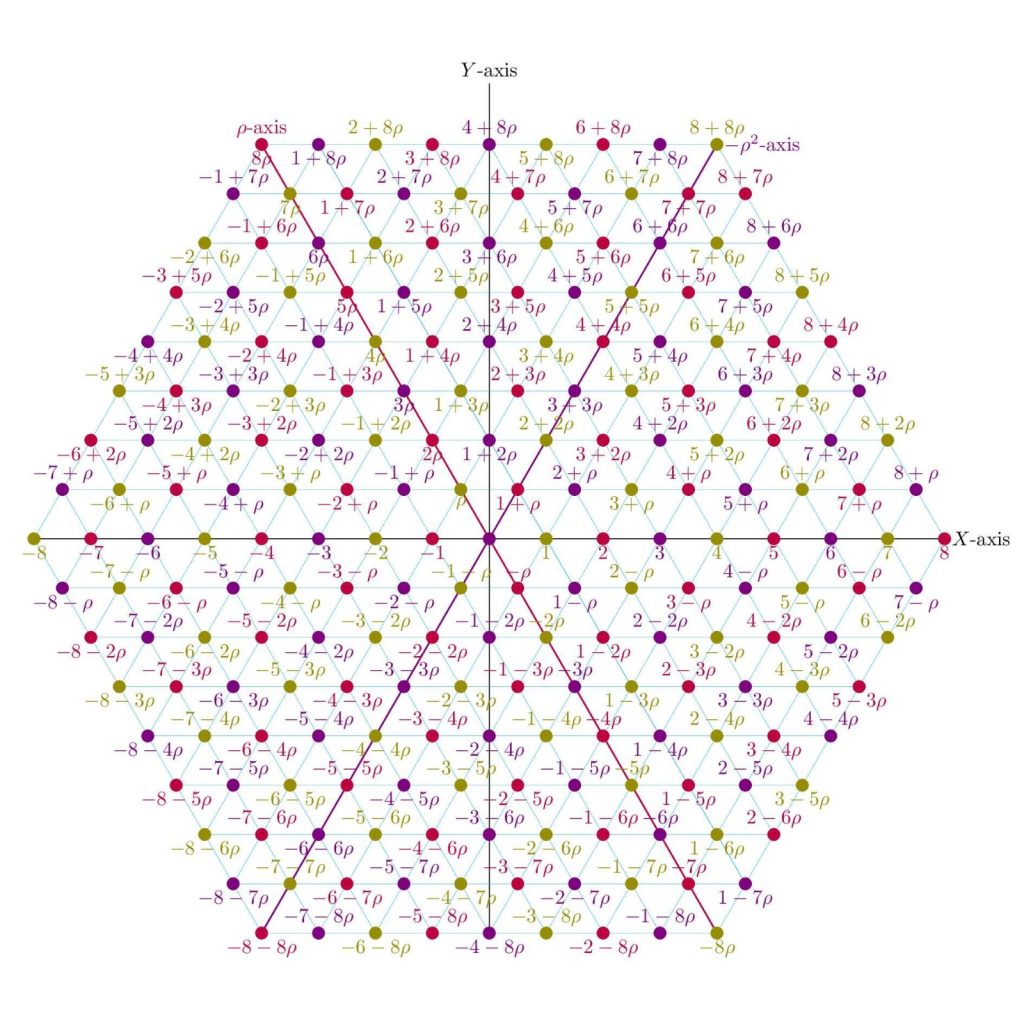
My work also visualizes even and odd numbers within a set of complex numbers. Through interactive visualization, the audience is invited to learn about other even and odd number concepts that appear outside of integers, particularly in the realm of complex numbers.
My work explores even and odd Eisenstein number patterns within a specific distance limit, revealing hidden structures rarely observed in complex mathematics. These numbers are classified into 3 categories based on their parity and visualized with different colors, forming a geometric landscape rich in symmetry and rhythm. Through this approach, the audience is invited to understand that the concepts of even and odd numbers are not only applicable to integers, but also have deep meaning and patterns within the complex number system.
Annisa Dini Handayan:
“This event is amazing. It collaborates on art and science to be a great artwork that we had never imagined before. We can obtain a different perspective of the art. It’s just so wonderful art”
At its heart, this magic poem paints a picture of grief for a nation facing hard times. But woven into that sadness is a thread of hope—the belief that a hero will rise to heal the land. What makes it truly special, though, is the secret hidden in plain sight. Beneath the surface story lies a coded message, meant only for the eyes of someone who holds the key.
This is the magic of steganography in art. The poet uses a mathematical formula to pick a single letter from each line. If you know how to find them and string those letters together, a whole new hidden message is revealed. This magic poem uses a simple formula ∛125 to determine the position of the letter in each line. So, you can pick the 5th letter of each line, and compose them to be a secret message.
Juli Loisiana Butar-Butar:
“The Event Data.RT gives a sense of profound astonishment. I quite often see depictions and representations of scientific research results expressed visually. But I did not expect that this would become an interesting part of science that I could enjoy from another field without having to understand it in depth, just as a layperson would.”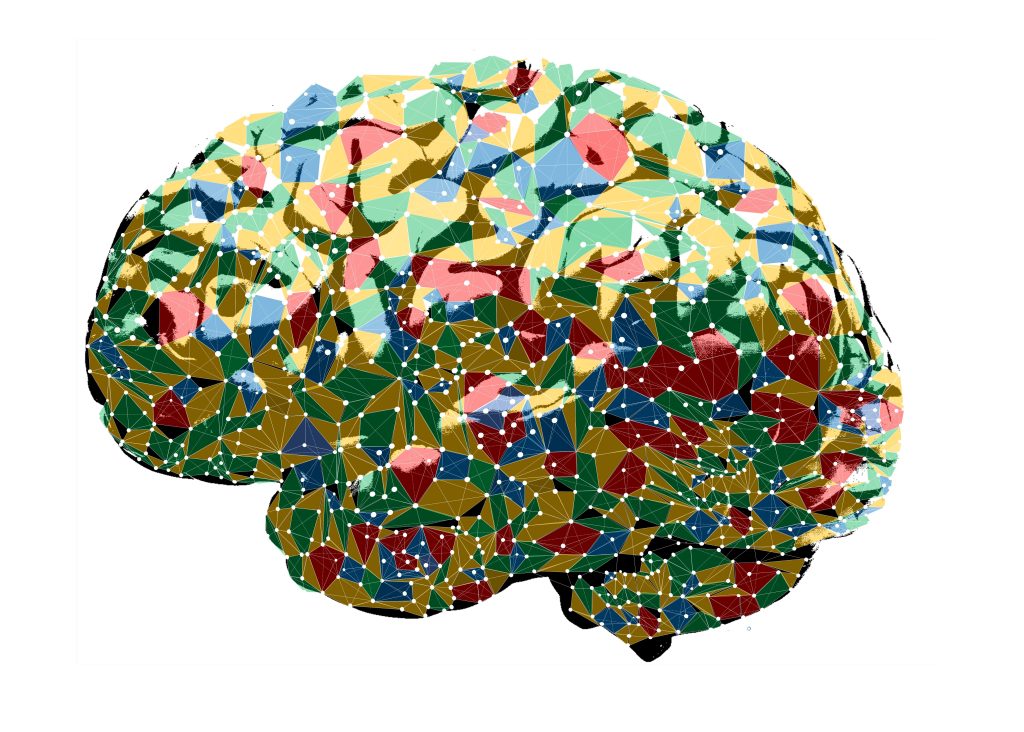
This artwork is intended as a simple representation to geometrically depict the neural network of the human brain. Neurons in the human brain are interconnected by a neural network and have a series of overlapping networks that involve not just two neurons, but more. This is what makes the brain’s work more complex and efficient, by simultaneously activating or suppressing many neural pathways. A simplicial complex is a combination of geometric objects in the form of points (0-dimensional), lines (1-dimensional), triangles (2-dimensional), tetrahedrons (3-dimensional), and so on. The simplicial complex represents the neural network in the human brain. The representation uses a vertex (point) as a neuron, an edge (line) as a neural pathway connecting two neurons, and a triangle or a higher-dimensional shape as the interaction of a group of neurons in the overlapping neural network of the human brain.
Felicia Servina Djuang:
“I’m really excited about this art exhibition that combines science. I think every aspect of life has an artistic side, including the research that scientists do. This exhibition gives me a space to appreciate the artistic value of scientific discoveries. Plus, I love seeing all the beautiful works that I never would have thought of before!”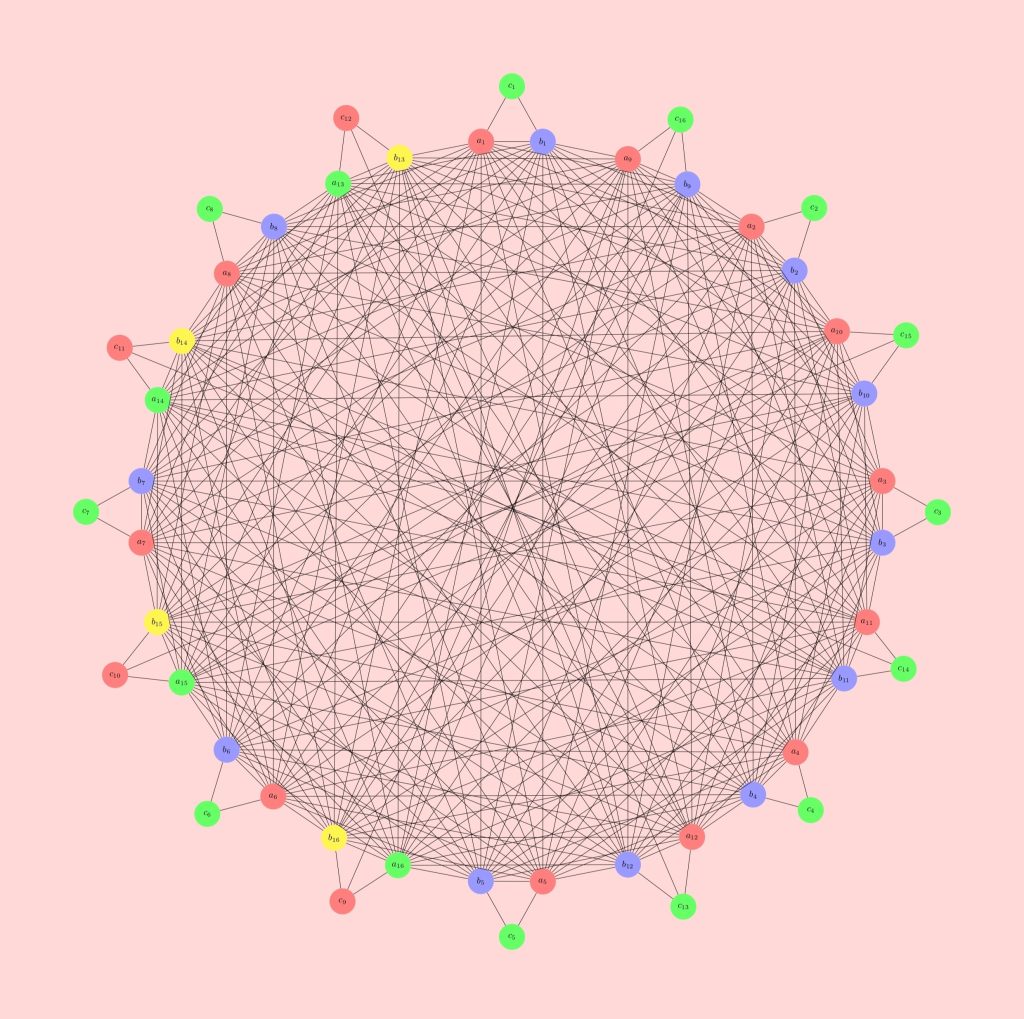
The shuriken graph represents precision, strategy, and multifaceted thinking. Its pointed tips symbolize sharp insight and cutting through complexity. The graph’s structure embodies adaptability, creativity, and the beauty of complex ideas.
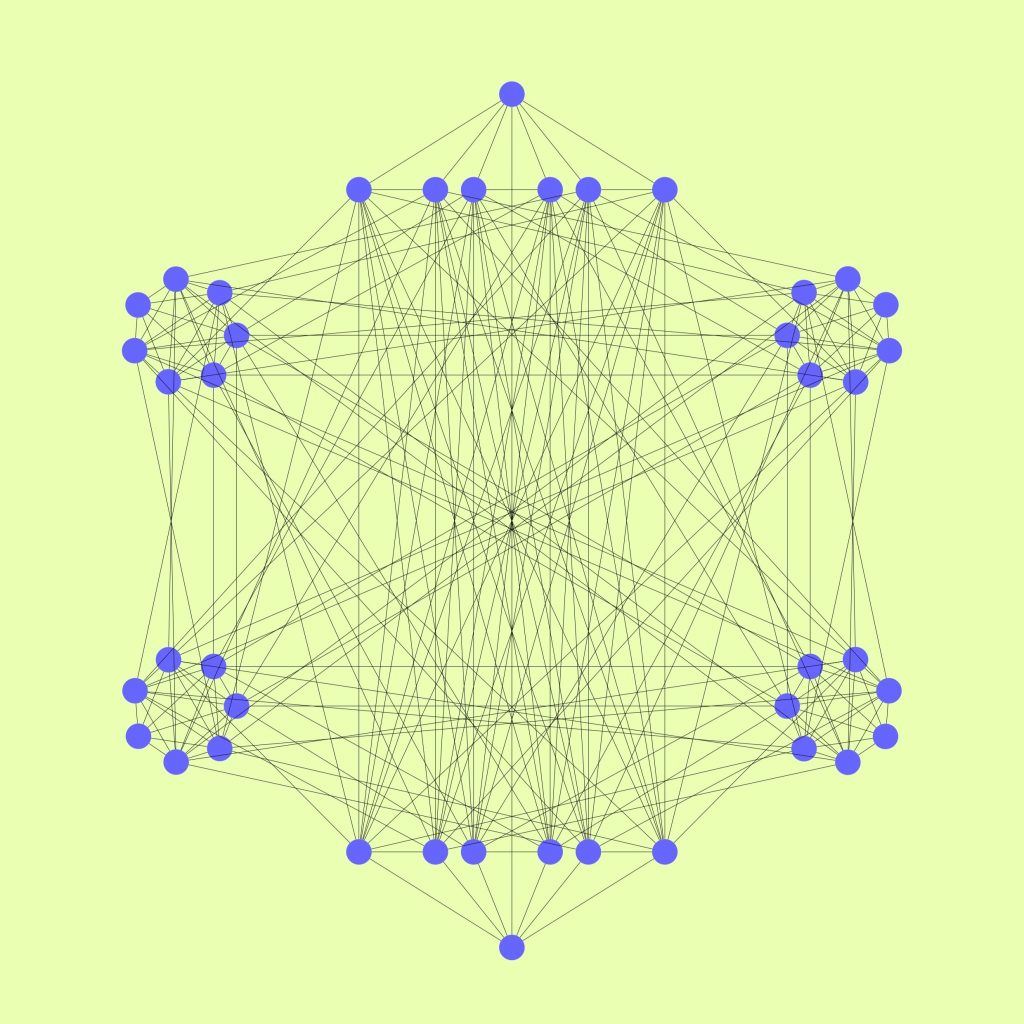
This graph was initially formed from the algebraic structure of a clean graph Cl_2 over the ring Z_{2q}. The resulting graph structure resembles a blade that is similar to a shuriken, a Japanese weapon. Later, this graph was generalized into a shuriken graph operation over the original graph. The shape of the shuriken graph still resembles the shuriken weapon, which has several sides with pointed tips.